Abstract
HF radio signal propagation conditions were analysed on a sub auroral radio path, Moscow-Dixon, using the signal intensity. Regular changes in the redistribution of signal amplitudes during substorms and the influence of the main ionisation trough are described.
Introduction
The behaviour of the ionosphere and HF wave propagation parameters and their possible changes can be described using ionospheric oblique sounding (IOS) data. With the help of this method the maximum observed frequency (MOF), the maximum useable frequency (MUF), the lowest observed frequency (LOF), the number of propagation modes and the signal delays can be determined. In the Arctic and Antarctic Research Institute there is a system allowing ordinary IOS ionograms to show, in addition, the distribution of signal levels for every mode in the range of radio frequencies from 3.5 to 27.5 MHz (Blagoveshchensky and Vystavnoi, 1991). The signal level is displayed as the vertical extent of the oblique ionogram trace. Thus, the value of the IOS equipment is enhanced by the new parameter.
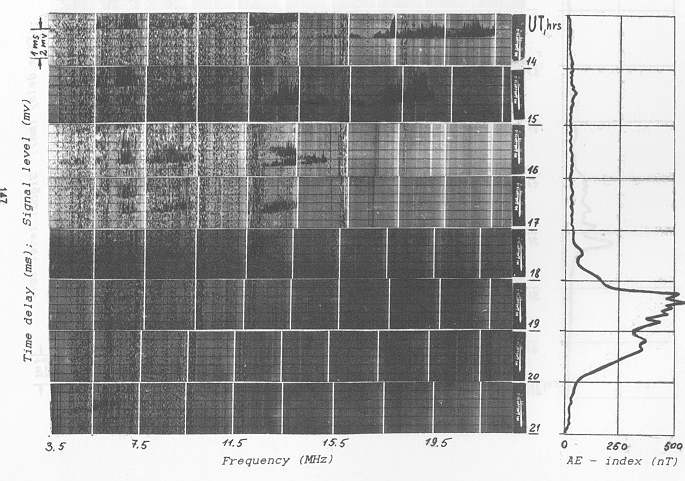
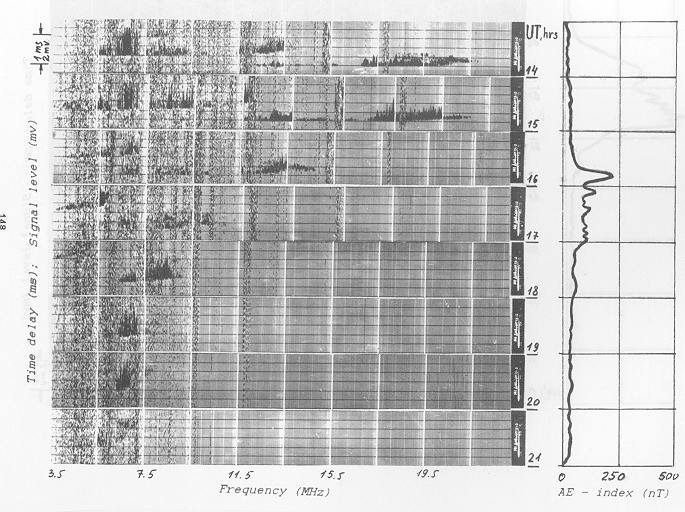
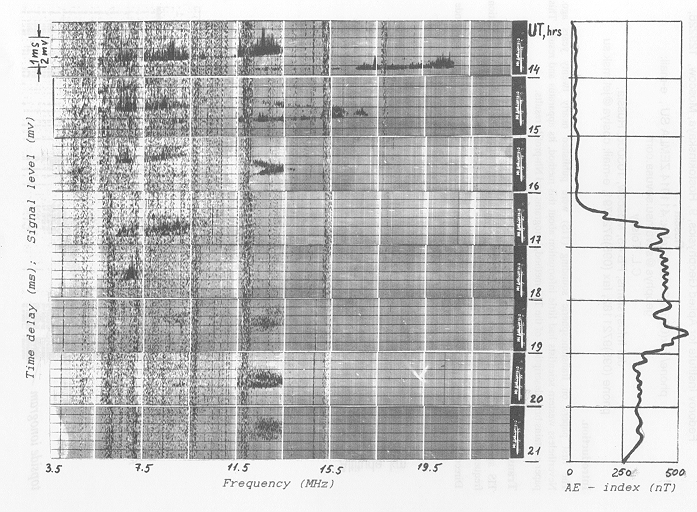
Examples of IOS ionograms, with signal levels, for three geophysical conditions for high latitudes are shown in Figures 1, 2 and 3. Experimental investigations were conducted on the high-frequency radio path Moscow-Dixon, with a length of 2,700 km. The measuring equipment and receiving and transmitting antenna characteristics were taken into account (Vystavnoi 1978). Data for winter (beginning of 1978) were analysed and the following problems were considered:
a) signal amplitude behaviour was described for ionospheric disturbances during periods of magnetospheric substorms and magnetic storms,
b) the influence of the main ionisation trough on the character of signals at the reception point was described.
Main Results and Discussion
In contrast to the earlier analysis of IOS ionograms during substorms and magnetic storms (Blagoveshchensky and Zherebtsov, 1987; Blagoveshchensky et al., 1992) where only the MOF, MUF and LOF were examined, the present investigation is concerned with variations in signal amplitude over the frequency range from 3.5 to 27.5 MHz, i.e. over the oblique sounding range. The ionograms studied were recorded during the winter nighttime in medium solar activity conditions. Ionograms recorded during periods of substorms, magnetically quiet periods and also continuous, gradual commencement storm periods were compared. Using all the data for winter, 1978, general features in the signal amplitude variations were revealed which can be observed in ionograms such as Figures 1, 2 and 3 which are typical of the different geophysical conditions. The sequence of ionograms, showing time delay (distance) versus frequency, during a single intense substorm is presented in the first figure. The second figure shows quiet conditions and the third is a sequence of ionograms during a storm of medium intensity. The ionograms were recorded between 14 to 21 UT on the 10th (Figure1), 11th (Figure2) and 12th (Figure3) of February 1978.
During the substorm (Figure 1), compared to the quiet period (Figure 2), the following is observed. The substorm is characterised by the AE index and the abrupt onset of the substorm occurs at 18 UT, this time being referred to as T = 0. About 4 hours before, at 14 UT, the signal amplitude begins to increase, mainly in the high-frequency range. Three hours before T = O, at 15 UT in both Figures 1 and 2, there is a considerable increase in HF signal level in part of the frequency range, extending to low frequencies. Two hours before T = O, at 16 UT, the whole frequency range is characterised by a raised signal level compared with the quiet period. Such regularity in amplitude variations is caused, most probably, by normal ionisation at the upper ionospheric layers and then particle precipitation in the lower ionospheric layers. Consequently, the signals are stronger near the MUF than through the whole frequency range when precipitation increases. Directly before T = 0, at 17 UT, the signal amplitude through the whole range corresponds to the quiet level. Immediately after T = 0, the signal gradually becomes weaker and during the substorm it becomes extraordinarily small, because of the increasing absorption starting at 18 UT and continuing through 19 and 20 UT. By the end of the substorm, the reflection picture is similar to the corresponding quiet period, at 21 UT.
A longer storm, of medium intensity with a gradual commencement is presented in Figure 3, and is characterised by the following features. Here also, 3 hours before T = 0 (16 UT in Figure3), the signal becomes intense in the lower part of the HF frequency range, and the intensity of the signal also increases in the lower frequency range, then 1 hour before T = 0, the intensity approaches the corresponding quiet period levels at 14 and 15 UT. After T = 0, the signal is absorbed in the low-frequency region and is absent from ionograms at 17 to 21 UT. However, as the comparison shows most clearly, the indicated effects of increasing signal intensity and absorption and its disappearance are displayed more clearly for a single impulsive substorm than for the gradual commencement storm.


The Influence of the Main Ionisation Trough
In quiet conditions (Figure 2), on average, the path intersects the trough from 18 UT and onwards through the night. The character of the reflected signal becomes ill defined; here and there diffuse without definite regularities. The frequency range with the intense signals is limited to only a few megahertz. The maximum observed frequencies do not exceed 8-9 MHz. Since the average reflection point of the path has a corrected geomagnetic latitude Q =59.6° , during the night in the absence of a disturbance, this point will never extend into the northern boundary of the trough or the auroral zone. That is why the picture of reflections observed on ionograms during the entire night remains approximately identical to the 19-21 UT period in Figure 2.

During disturbances, the situation changes. First of all, when the disturbance intensity increases, the average reflection point of the path intersects the trough earlier, for example, at 17 UT in Figure 3. In the second place, the average reflection point of the path extends into the northern boundary of the trough, beginning from 19 UT. Reflections maintain a stable maximum signal character and lie in the range 10 to 14 MHz. Ionograms show diffuse structure from 19 UT (Figure 3) because the signal is reflected from the equatorial boundary of the diffuse precipitation zone, which forms the poleward edge of the main ionisation trough. At 20 UT the signal becomes intense and pronounced. After 21 UT, diffuse reflection structure is obtained again before the transition of the average reflection point of the path from the northern boundary of the trough into the auroral activity zone.
Conclusion
(i) New data about the redistribution of signal levels during the growth phase of a pre-midnight substorm, with sharp onset, were shown. About 3-4 hours before the moment of onset, parameterised by the AE-index at T = O, there is a signal intensification at frequencies approximately from 15 MHz to 25 MHz. Two hours prior to T = O there is a more intense increase in signal level at frequencies less than 15 MHz, i. e., in the low-frequency part of the oblique ionogram.
(ii) The influence of the main ionisation trough on the Moscow to Dixon path at first appears to show diffuse signals. Then there are steady reflections from the northern wall of the trough. Once again there are diffuse signals. The range of steady reflections falls in the range of a few megahertz and the disturbance level determines its temporal position.
References
1. Blagoveshchensky D.V., Bystavnoi V.M. Investigation of the oblique sounding signal structure on high-latitude radio tone. Studies on Geomagnetism, Aeronomy and Solar Physics, Moscow. Nauka, v.93, pp. 92-100, 1991.
2. Vystavnoi V.M. Two Methods of Amplitude Characteristics Investigation of Ionosphere Oblique Sounding Signals. Trudy AANII, Leningrad, Gidrometeoizdat. v.351, pp.45-52, 1978.
3. Blagoveshchensky, D.V., Zherebtsov, G.A. High-Latitude Geophysical Phenomena and Prediction of HF Radio Channels, Moscow. Nauka, p.272, 1987.
4. Blagoveshchensky, D.V. et al. High Latitude Ionospheric Phenomena Diagnostics by HF Radio Wave Propagation Observations. Radio Sci., v.27, N 2, pp. 267-274, 1992.